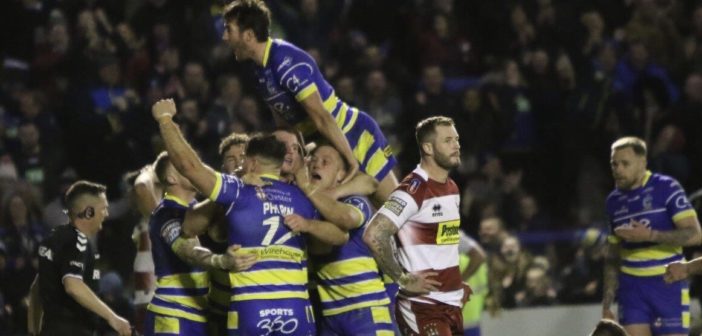
WARRINGTON Wolves have been ranked a credible 23rd place in a recent study of professional sports clubs on social media, above Manchester United.
“The Social Scorecard: Sports“, by search marketing agency Red Hot Penny, examines how the UK’s top professional sports clubs across football, rugby, cricket, basketball and ice hockey are engaging with their social media followers, and if they’re effectively leveraging their followings to drive their retail business.
A total of 80 clubs were analysed comprising of the top 10 English clubs from Super League (rugby league), the Premier League (football), Scottish Premiership (football), Premiership (rugby union), Pro14 (rugby union), County Championship (cricket), Elite Ice Hockey League (ice hockey) and British Basketball League (basketball).
Warrington ranked in third amongst Super League clubs, behind Leeds and Wigan.
The overall score was calculated by a club’s total followers, follower numbers per seat, their total average post engagement and total engagement rate, along with three overall performance scores for each channel (Facebook, Twitter and Instagram).
The aim of the analysis was to see which clubs were really connecting with their fans, and to see how much potential their social channels have to boost retail activity.
Conor vs Khabib? Jones vs Cormier? Tyson vs Holyfield?
Wolves vs Wigan has more bad blood than all three! 👊 pic.twitter.com/H5YLL5Zb3n
— Warrington Wolves (@wolvesrl) March 14, 2019
They did boast one of the best followers per seat ratios, with the Wolves having 10 followers per ticket available in the Halliwell Jones Stadium.
The average post engagement for Warrington on social media is 1,532, which puts them in 37th place.
It was on Twitter that the Wolves scored best, finishing 5th out of the 80 clubs, behind only league rivals Salford, Scottish football clubs Kilmarnock and Celtic, and county cricket side Yorkshire – while on Facebook, Warrington came in 14th place.
| Sport | Team | Total Score | Followers | Per Seat | Avg ER | |
| 1 | Cricket | Somerset | 82.000 | 379,405 | 45 | 4.03% |
| 2 | SPL | Celtic | 78.500 | 2,781,377 | 46 | 1.48% |
| 3 | PL | Spurs | 76.750 | 16,310,000 | 263 | 1.56% |
| 4 | PL | Everton | 74.500 | 5,572,000 | 141 | 1.41% |
| 5 | Rugby Union | Northampton | 74.375 | 241,830 | 16 | 1.10% |
| 6 | PL | Man City | 74.125 | 51,280,000 | 931 | 1.23% |
| 7 | PL | Arsenal | 73.000 | 63,900,000 | 1,067 | 0.95% |
| 8 | Rugby Union | Exeter | 72.750 | 237,749 | 22 | 1.06% |
| 9 | PL | Liverpool | 71.875 | 52,900,000 | 978 | 1.15% |
| 10 | SPL | Rangers | 71.250 | 1,322,505 | 26 | 1.73% |
| 11 | PL | Chelsea | 70.750 | 73,400,000 | 1,763 | 0.80% |
| 12 | Cricket | Essex | 69.875 | 183,890 | 33 | 1.62% |
| 13 | Rugby League | Leeds | 68.250 | 395,896 | 19 | 0.36% |
| 14 | Pro 14 Rugby | Ulster | 68.250 | 373,442 | 21 | 1.42% |
| 15 | SPL | Kilmarnock | 66.625 | 54,141 | 3 | 7.29% |
| 16 | SPL | Aberdeen | 66.250 | 235,436 | 11 | 2.01% |
| 17 | Pro 14 Rugby | Leinster Rugby | 66.250 | 559,377 | 30 | 1.28% |
| 18 | Rugby League | Wigan | 65.750 | 235,082 | 9 | 0.69% |
| 19 | Rugby Union | Harlequins | 64.625 | 283,040 | 19 | 0.88% |
| 20 | Rugby Union | Bath | 64.375 | 273,901 | 19 | 0.78% |
| 21 | Pro 14 Rugby | Glasgow Warriors | 64.250 | 186,561 | 39 | 2.44% |
| 22 | SPL | Heart of Midlothian | 63.875 | 142,855 | 7 | 2.76% |
| 23 | Rugby League | Warrington | 63.500 | 157,844 | 10 | 0.68% |
| 24 | PL | Leicester City | 63.000 | 10,290,000 | 318 | 0.60% |
| 25 | Rugby Union | Gloucester | 62.250 | 249,193 | 15 | 0.73% |
| 26 | PL | Man Utd | 62.125 | 115,500,000 | 1,540 | 0.37% |
Notes: All data was captured between the 5th November and 7th December 2018 and all stadium capacities were correct at the time of publication.


1 Comment
Blake Austin scored four tries as Warrington thrashed Hull 63-12 at the KCOM Stadium to continue their flying start to the Betfred Super League … by Followers Australia